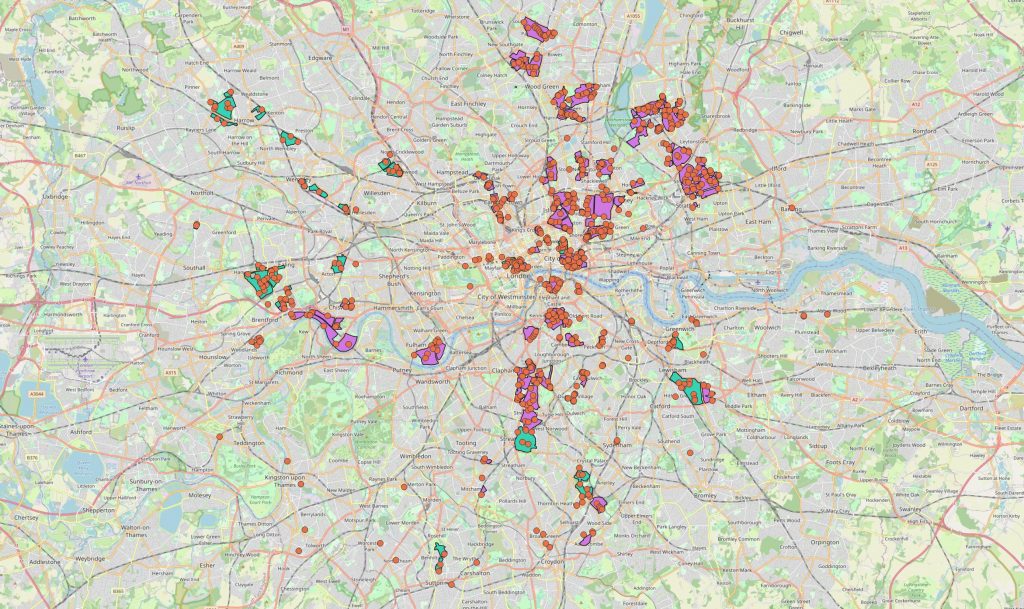
London LTN dataset – updated!
Download the files here – but please read the notes below too!
Here’s our updated version of the London LTN dataset, up to August 2024! We’ve included implementation dates and (where relevant) removal dates for all LTNs implemented from 2020 in London. We’ve also included earlier LTNs introduced from 2015 in Waltham Forest, which we’ve analysed in various studies and papers. We think that this represents all London LTNs introduced from 2015 to August 2024, but if we’ve missed something or got something wrong (or if you’d like to let us know what you’re doing with the data!), please do email us at activetravelacademy@westminster.ac.uk.
New version – LTN filters dataset, 2015 to August 2024 (geojson) – download link
New version – LTN areas dataset, 2015 to August 2024 (geojson) – download link

Older version – LTN filters dataset, March 2020-Nov 2022 (geojson) – download link
Older version – LTN areas dataset (geojson), March 2020-Nov 2022 – download link
Since the introduction of emergency Low Traffic Neighbourhoods (LTNs) from March 2020, we (ATA) have been gathering data on LTNs in London. This has often been quite time-consuming as they have been introduced sporadically by around two-thirds of the capital’s 33 districts, and as we’ve also monitored removal and (as far as possible) other changes to the modal filters making them up.

We are now making the latest version of the dataset available – it runs to November 2022 and includes both modal filters and LTN area maps. There are a couple of notes to add here regarding the LTN areas. We have defined these very narrowly, as only being streets newly filtered by the LTN in question. This was because we initially developed the dataset to look at equity in relation to people living in newly filtered areas (see this paper).
For other purposes, such as our work on changes in motor traffic levels in and around LTNs, a wider definition might be more appropriate (in that case, we felt it important also to look at changes in the rest of a traffic cell where streets are not newly filtered, to get a more representative picture of impacts within the traffic cell as a whole).
We have only defined a new LTN as being one where, in our view, more than one street is newly filtered – so that it is an area-wide scheme even if the area is small. LTNs that have been removed are included within the dataset (there is a field for date removed), apart from in Wandsworth and Redbridge where schemes were in for a very short period of time, and thus looking at equity distribution/impacts did not make sense in our view. Dates of introduction and removal are as accurate as possible but mostly, I would assume they are not more accurate than for the month in question.
Some of the LTN areas were not defined as such by the authorities in question, but we see them as having similar characteristics. In a few cases, we have noted on the ‘LTN area’ file that an area may be a ‘quasi-LTN’ – where for instance filters are only active for a few hours a day, or where the schemes seemed more akin to ‘streateries’ (where the goal is more around boosting cafes and restaurants during summer months, and restrictions are designed accordingly).
Finally, the data has been updated to November 2022, so does not include changes or new schemes since then. We hope to release newer versions in due course.
Questions? Noticed any errors? Want to let us know what you’re doing with the data? Please email activetravelacademy@westminster.ac.uk.